Terminal Analytics
View cost breakdowns, model usage, project activity, and today's sessions directly in your terminal with the code-insights stats command suite.
Overview
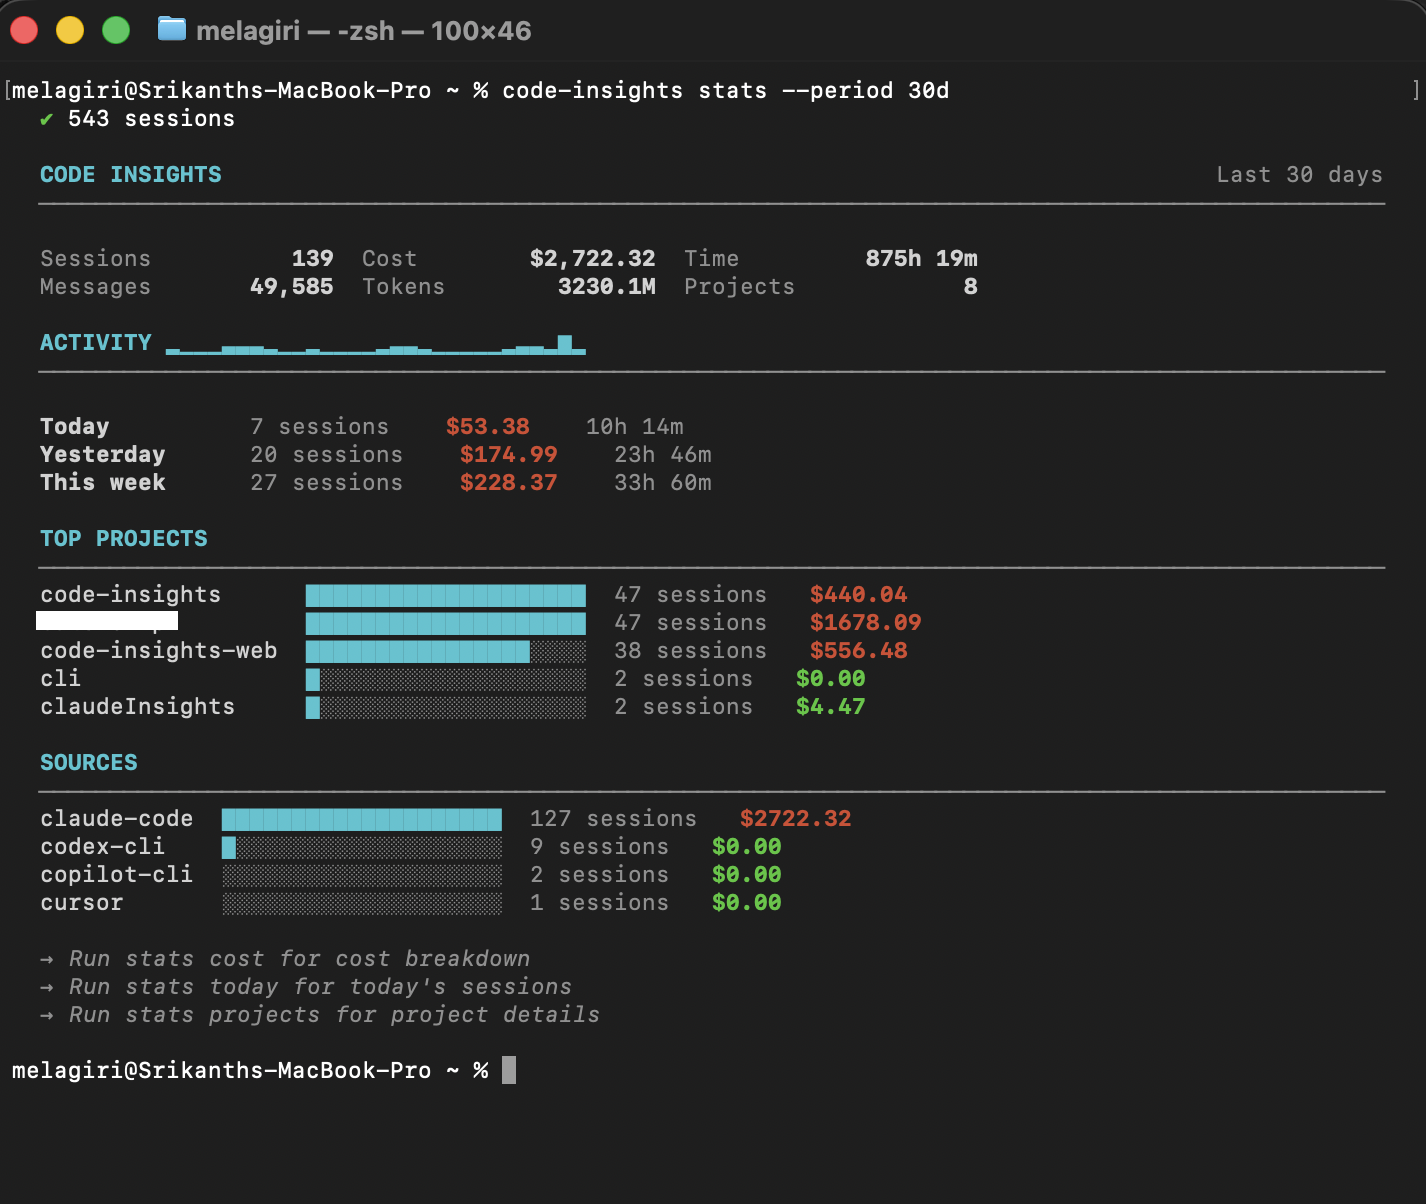
code-insights statsShows a dashboard overview for the last 7 days: session count, messages, tool calls, duration, cost, and an activity chart.
Subcommands
Cost breakdown
code-insights stats costCost breakdown by project and model. Shows token usage, cache hits, and USD cost.
Per-project details
code-insights stats projectsDetail cards for each project: session count, duration, character distribution.
Today's sessions
code-insights stats todayAll sessions from today with titles and durations.
Model usage
code-insights stats modelsModel usage distribution: session count, message count, and cost per model.
Shared flags
All stats subcommands support these flags:
| Flag | Default | Description |
|---|---|---|
--period 7d|30d|90d|all | 7d | Time range |
--project <name> | — | Filter to a specific project |
--source <tool> | — | Filter by source tool |
--no-sync | — | Skip auto-sync before showing stats |
Examples
# Cost for the last 30 days
code-insights stats cost --period 30d

# Today's sessions for a specific project
code-insights stats today --project my-app

# Model usage for Cursor sessions only
code-insights stats models --source cursor